Updated: 06 June 2026
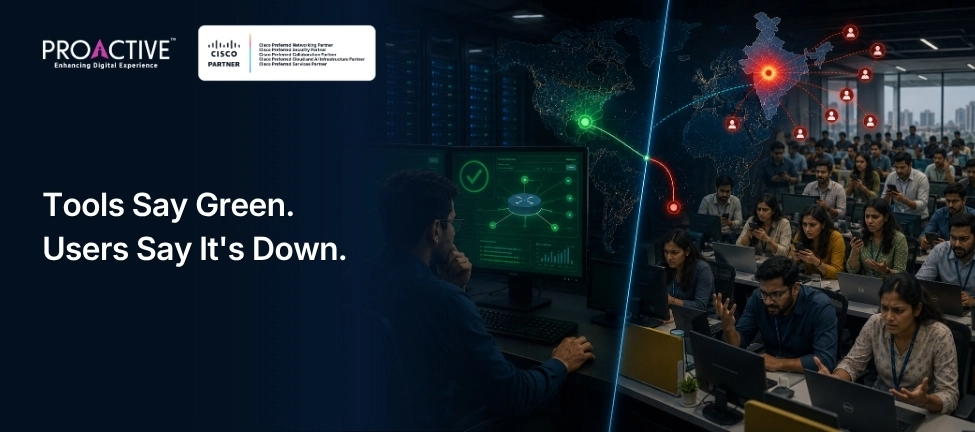
Unplanned downtime costs large enterprises around US$23,750 per minute (roughly ?20 lakh per minute, or ?12 crore per hour) per the BigPanda 2024 outage-cost study, and 20 to 40 per cent of that cost goes on the impact-assessment phase: figuring out who is affected and where. Traditional network monitoring still tells you a router is up. It does not tell you that 600 users in your Pune office cannot reach Salesforce because an ISP backbone in Singapore is dropping packets. Network observability does. Most network observability pages on this site explain definitions. This one is the rollout and ROI view.
Monitoring answers "is it up?" against predefined thresholds, mostly via SNMP polls on devices you own. Observability answers "why is it slow, for whom, and where on the path?" by correlating logs, metrics, traces and synthetic tests across the network you own, the internet you do not own, and the SaaS estates your users depend on.
The shift matters now because the network most Indian enterprises actually run no longer sits inside the firewall. It runs across ISPs, SD-WAN, public cloud, SaaS, secure web gateways, mobile users and contractor laptops.
The Five Telemetry Pillars of a Modern Observability Stack
| Pillar | What It Captures | Why It Matters |
|---|---|---|
| Metrics | Time-series performance and health data from devices, links and apps | Baseline for trend analysis and alerting |
| Logs | Detailed event records from devices, controllers and SaaS APIs | Root-cause reconstruction after incidents |
| Traces | End-to-end path of a user request across services | Spots which hop or service is slowing the user journey |
| Synthetic tests | Scripted probes that simulate user activity from named locations | Catches an outage before any real user does |
| Real user telemetry | Endpoint-agent data from actual user devices | Shows the gap between average performance and the worst user's experience |
A monitoring tool gives you the first two. An observability platform fuses all five.
Three numbers, sourced from ITIC, Forrester and the BigPanda 2024 outage-cost study. Outages average around US$14,056 per minute (≈ ?12 lakh per minute) across enterprises. 91 per cent of enterprises report a single hour of downtime costs more than US$300,000 (≈ ?2.5 crore), with 44 per cent reporting losses exceeding US$1 million per hour (≈ ?8.3 crore).
Roughly 20 to 40 per cent of that cost is the impact-assessment phase. Observability collapses that window from hours to minutes by lighting the whole path at once.
AIOps is the layer that turns observability data into action. Cisco's AIOps stack uses Splunk's anomaly detection, AppDynamics correlation and ThousandEyes path intelligence to auto-classify incidents and pre-populate tickets before a service-desk agent picks them up. The 20 to 40 per cent impact assessment cost falls hardest here.
Cisco ThousandEyes for digital experience and internet-path visibility. Synthetic tests, endpoint agents and a global vantage-point grid show whether the slowness sits on your ISP, the backbone, the SaaS provider's edge or your own LAN.
Catalyst Center (formerly DNA Center) for campus and branch analytics, with AI-driven baselining and client health scoring across Catalyst switching and wireless.
Meraki Dashboard for cloud-managed wired, wireless, SD-WAN MX and security analytics in a single pane.
Cisco Nexus Dashboard Insights for data centre fabric observability across Nexus 9000 and ACI, with latency tracking, configuration drift detection and pre-failure prediction on the spine-leaf fabric. The core of any BFSI observability rollout.
Cisco Provider Connectivity Assurance (the rebranded Accedian Skylight) for measuring whether the ISP is actually delivering the SLA you are paying for. Indian multi-ISP enterprises use it to enforce credit clauses against carriers.
AppDynamics and Splunk Observability Cloud for application traces, log analytics and the cross-domain correlation that turns a network event into a business event. Since Cisco's 2024 acquisition of Splunk, ThousandEyes and Splunk Observability Cloud are integrated under a single Cisco unified observability strategy, with shared identity, shared data fabric and joint engineering, which is the single largest differentiator against standalone APM and network monitoring vendors.
If the estate is heavily on Microsoft 365 and Azure, Azure Monitor and Network Watcher cover the cloud-side observability; ThousandEyes still wins on internet-path and SaaS visibility outside Azure. If application observability already sits on Datadog, Dynatrace or New Relic, the Cisco network observability stack travels beside it.
BFSI focuses on data centre fabric (Nexus Dashboard Insights) and SaaS path assurance (ThousandEyes) for trading, core banking and customer apps.
Manufacturing focuses on plant-floor-to-ERP path observability and SD-WAN under-the-hood (Meraki and Catalyst Center).
ITeS focuses on agent desktop telemetry and SaaS reachability for Okta, Salesforce, Microsoft 365 and the principal's CRM.
Across all three: target mean time to identify the affected user population in single-digit minutes for a P1. Most Indian estates measure this in hours today, against published Forrester and Ponemon benchmarks.
What Does a 60-Day Rollout Look Like?
| Phase | Activity |
|---|---|
| Days 1 to 10 | Application priority list. Top 25 internal and SaaS apps, ranked by business impact. ISP and SaaS path inventory. |
| Days 11 to 25 | Deploy ThousandEyes enterprise agents in key sites (Mumbai, Bangalore, Pune, Delhi-NCR, plus the largest plant or BPO floor). Stand up synthetic tests for the top 25 apps. |
| Days 26 to 40 | Roll out ThousandEyes endpoint agents to a pilot pod of 500 users. Integrate ServiceNow or your ITSM for ticket auto-enrichment. |
| Days 41 to 60 | Wire Catalyst Center, Meraki Dashboard and Nexus Dashboard Insights into the same analytics layer. Stand up the unified dashboard for SOC, NOC and service desk. |
Proactive Data Systems is a Preferred Partner under the Cisco 360 Partner Program across Networking, Security, Collaboration, Cloud & AI, and Services. We design and deploy network observability stacks built on ThousandEyes, Catalyst Center, Meraki Dashboard, Nexus Dashboard Insights, Provider Connectivity Assurance and Splunk Observability Cloud for Indian enterprises in BFSI, manufacturing and ITeS.
Book a Network Observability Workshop. Ninety minutes. Your top 25 apps, your ISP footprint, your current monitoring stack. A gap analysis and a 60-day rollout plan in your hands within ten working days.

Proactive Enterprise Networking Team
We'll get back to you shortly.