Updated: March 27, 2026
The calls are live. The complaints are louder. Here is how to find what is actually wrong and fix it without guessing.
Read This First
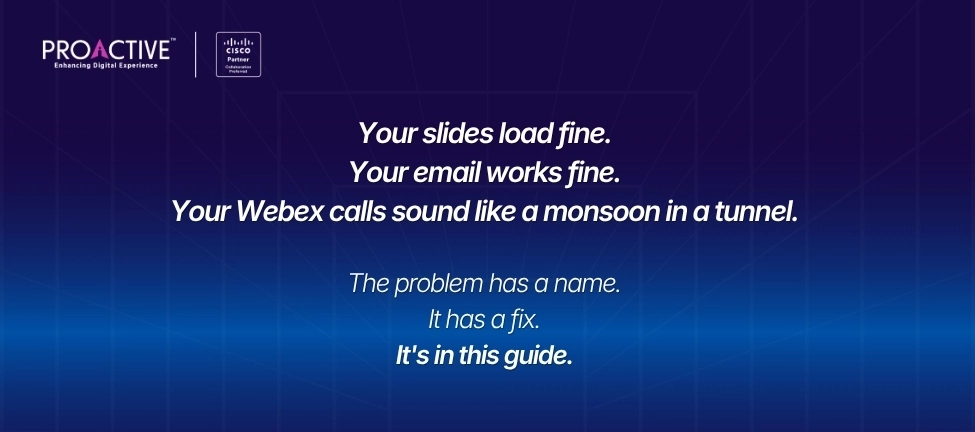
There is a specific kind of frustration that comes from a Webex deployment that is technically working. The platform is licensed. The endpoints are registered. The calls connect. But every week, someone sends the same message to the IT helpdesk:
"The call quality is terrible. Can you fix Webex?"
The first thing to understand is that Webex is almost certainly not the problem. Webex is reporting the problem. The MOS score — Mean Opinion Score, the industry standard measure of voice quality on a scale of 1 to 5 — is the diagnostic instrument, not the patient. A score of 3.8 means a caller experiences occasional distortion, choppy audio, or echo. A score of 4.2 is where most users stop noticing quality at all. The gap between those two numbers lives entirely in the network path.
The second thing to understand is that the gap is findable. It has a cause. In Indian enterprise environments, it is almost always one of four causes. This guide walks through how to identify which one, using tools you already have, and exactly what to do about it.
Before running any diagnostic, establish whether you have a problem worth investigating — and how severe it is. These are the thresholds your Control Hub data should consistently meet in a well-configured Indian enterprise Webex deployment.
| Metric | Target | Acceptable | Investigate | Likely Cause |
|---|---|---|---|---|
| MOS score | 4.2+ | 4.0–4.2 | Below 4.0 | All four causes |
| Packet loss | < 0.5% | 0.5–1% | > 1% | ISP, MPLS |
| Jitter | < 15ms | 15–30ms | > 30ms | ISP, QoS, WFH |
| Round-trip latency (India–PoP) | < 80ms | 80–120ms | > 120ms | PoP routing, ISP |
| Upload per voice call | 150 Kbps | 100–150 Kbps | < 100 Kbps | MPLS, WFH BW |
| Upload per HD video call | 2 Mbps | 1.5–2 Mbps | < 1.5 Mbps | MPLS, WFH BW |
Source: Cisco Webex Network Requirements documentation; ITU-T G.107 E-Model. India PoP latency figures and ISP throughput data: Proactive Data Systems field observations and WFH deployment assessments, India metros, 2024–2026.
How users experience each MOS band — what IT hears and what to do:
| MOS | User Experience | What IT Hears | Action |
|---|---|---|---|
| 4.3–4.5 | Excellent — not noticed | Silence | Nothing. Maintain this standard. |
| 4.0–4.2 | Good — slight impairment | Occasional low-priority ticket | Monitor trends in Control Hub Analytics |
| 3.6–3.9 | Noticeable — complaints start | Regular helpdesk tickets | Run diagnostic sequence in this guide |
| 3.0–3.5 | Poor — active complaints | Escalation to IT Head | Immediate investigation. Check ISP incident first. |
| Below 3.0 | Unusable | CXO-level complaint | Escalate immediately. Phone bridge as interim. |
Control Hub logs MOS, jitter, packet loss, and latency for every Webex call — broken down per call leg. A leg is a discrete network segment: from the caller's endpoint to the Webex cloud, and separately from the cloud to the recipient's endpoint. When a call sounds bad, Control Hub tells you which leg is degraded, which endpoint, and when.
What the numbers mean mechanically: per ITU-T G.107 E-Model, each additional 1% of packet loss above 0% reduces MOS by approximately 0.4–0.5 points. Jitter above 30ms degrades MOS independently of packet loss, as the jitter buffer adds compensating delay to absorb variation. These two variables compound — 1% packet loss combined with 30ms jitter produces a worse score than either alone. This is why the thresholds in Section 1 are not arbitrary: they mark the exact points where the E-Model calculation crosses below the 4.0 floor.
A call between a Bangalore office user and a WFH user in Whitefield has four potential problem locations: the office internal network, the office last-mile ISP, the WFH user's Jio or Airtel connection, or the WFH user's home Wi-Fi. Per-leg data in Control Hub collapses that ambiguity in one screen. Without it, you are troubleshooting blind.
Navigation Path
Three Numbers That Matter Per Leg
Come to every ISP escalation, every vendor call, every TAC case with data. 'Calls sound bad' takes three days. Specific leg metrics with timestamps take three hours.
Cause 1: Last-Mile ISP Variability
Control Hub Pattern
Jitter spikes on the outbound leg. Worse at 10 AM and 3 PM. Worse Mondays. Better at 7 AM and weekends. Consistent across multiple users at the same office location simultaneously.
The most common cause in Indian offices — and the most frequently misdiagnosed as a Webex problem. Indian enterprise internet, even on contracted SLAs, has significant real-world last-mile variability. A 100 Mbps Airtel or Tata IQ circuit with a 99.9% uptime SLA can deliver 58 Mbps average during business hours on a congested last-mile segment. Uptime and quality are different contracts.
On latency baselines specific to India: Webex routes Indian traffic to its Mumbai and Chennai media PoPs. On a well-provisioned Airtel Business or Tata IQ fibre circuit, round-trip latency from Bangalore to the Mumbai PoP typically measures 28–45ms; from Hyderabad, 35–55ms; from Delhi NCR, 40–65ms (Proactive Data Systems field observations, 2024–2026). If Control Hub shows 150ms+ for users in these cities, the call is not routing to the nearest PoP — a DNS or BGP routing issue to investigate before anything else.
Diagnostic Test
Fix
Cause 2: QoS Not Configured for Voice Traffic
Control Hub Pattern
Quality degrades across all users simultaneously during business hours. Jitter and packet loss correlate with general congestion events — large file transfers, software update windows, backup jobs. MOS recovers when the network is lightly loaded.
The most correctable cause — and the most frustrating to find, because it means the fix takes 30 minutes and should have been done on deployment day. Without QoS, your network treats a Webex voice packet identically to a Windows Update payload. During congestion, it drops whatever it needs to. A SharePoint packet that arrives 80ms late is invisible to the user. A voice packet that arrives 80ms late is a gap in a sentence. Correctly configuring DSCP EF (decimal 46) on a congested enterprise network typically recovers 0.2–0.4 MOS points — enough to move a 3.8 score to 4.0–4.2 with no hardware changes, per Cisco Webex network quality documentation.
Important: Configuration Steps Below Are Cisco-Specific
The diagnostic test works regardless of vendor. The fix steps apply to Cisco Catalyst, Meraki, and DNA Center. On Juniper EX or Aruba switching: the DSCP EF/AF41 principle is universal — the CLI and navigation differ. Consult your platform's QoS documentation.
Diagnostic Test
Fix — Cisco Catalyst 9000 Series
Fix — Cisco Meraki
QoS unconfigured is the most embarrassing cause to find — a 30-minute fix that should have been done on deployment day. It is also the highest-return single action in this guide.
Cause 3: WFH Endpoints on Asymmetric Broadband
Control Hub Pattern
Degradation isolated to specific users' outbound legs. Office-side legs are clean. Pattern is user-specific, not time-correlated. Same two or three users generate most tickets. They are all working from home.
A Jio Fiber 100 Mbps plan provides roughly 100 Mbps downstream and 30–50 Mbps upstream under normal conditions — but during peak hours (9–11 AM and 2–4 PM on business days), real-world upstream throughput in Indian metro residential areas drops to 18–35 Mbps on the same plan: 35–65% below the contracted rate (Proactive Data Systems WFH deployment assessments, India metros, 2025). Webex voice requires approximately 100 Kbps upload per call, which sounds like abundant headroom. The problem is contention: a home connection shared with a 4K Netflix stream, a child gaming online, and a background OneDrive sync will have its upload path squeezed unpredictably. Voice packets, small and numerous, lose the queue to larger bulk transfers.
Wi-Fi adds its own layer. A WFH user on 5GHz in a Mumbai or Bangalore apartment building is competing with 30–40 neighbouring networks on the same band. Interference causes retransmissions, which appear as jitter spikes in Control Hub.
The asymmetry creates a diagnostic trap: the WFH user's own audio sounds fine to them because the inbound (download) path is clean. Everyone else on the call hears the degradation. Tickets come from the office side, get assigned to the office network, and waste cycles. Control Hub's per-leg view is the only clean resolution.
Diagnostic Test
Fix — in Order of Invasiveness
Cause 4: MPLS Leased Line Bandwidth Exhaustion
Control Hub Pattern
Degradation across multiple users at the same branch location. All affected users show degraded outbound leg metrics. Other branches on the same deployment are clean. Pattern is time-correlated to business hours at that specific branch only.
MPLS circuits to Indian branch offices are typically provisioned at 2, 4, 8, or 16 Mbps — sized at a point in time based on the headcount and traffic profile that existed then. Since that sizing conversation: headcount has grown, applications have become heavier, and Webex has replaced the PBX.
The maths are unambiguous: 10 concurrent Webex HD video calls consume approximately 20 Mbps of upload bandwidth — 2 Mbps per session at 720p, per Cisco Webex network requirements documentation. A 4 Mbps MPLS circuit supporting those calls is 5x over capacity before accounting for email, file access, and browser traffic. QoS can prioritise voice within the available bandwidth — but it cannot create bandwidth that does not exist. At 70%+ sustained circuit utilisation, queuing delay degrades voice MOS even with QoS perfectly configured.
Diagnostic Test
Fix
Manager's Summary — Four Causes, Four Fixes
Use this sequence for every quality complaint before escalating externally. 20–40 minutes per case. Resolves the majority without a TAC case or ISP escalation.
Step 1 — Pull Control Hub Data for 3 Affected Calls
Step 2 — If User Outbound Leg is Degraded
Step 3 — If User Inbound Leg is Degraded
Step 4 — Quick QoS Verification
Scenario 1: Degradation on Both Legs Without a status.webex.com Incident
Most likely: codec negotiation fallback, particularly in environments with older Cisco IP phone firmware or a mix of hardware and software endpoints. Check all hardware endpoint firmware versions. Also check whether the issue is specific to calls between internal users vs. calls to PSTN numbers — the latter may point to a PSTN gateway quality issue on a hybrid calling deployment.
Scenario 2: Jitter Pattern Fits Both ISP Variability and QoS Unconfigured
Distinguish them with an internal-only file transfer test: copy a large file between two machines on your internal network with no new internet traffic. If call quality degrades during a purely internal transfer, QoS is the cause — the ISP is not involved in internal traffic. If quality holds during an internal transfer but degrades when you add internet traffic simultaneously, ISP last-mile is the cause.
Scenario 3: WFH User — Clean on mediatest.webex.com, Degraded in Real Calls
The mediatest tool measures the connection at one point in time. Real Webex calls run 30–60 minutes through variable conditions. Ask the user to run a 30-minute iPerf session to a public server during a normal working morning. Also check whether degradation is worse in the afternoon — ISP peak-hour contention in Indian residential areas typically worsens from 2 PM onward, which is different in pattern from home network contention.
Webex call quality in Indian hybrid enterprise deployments is frequently asymmetric in a specific way: office-side call legs show clean MOS in Control Hub while WFH-side legs show jitter spikes — because Indian consumer broadband (Jio Fiber, Airtel FTTH) delivers significantly lower and more variable upstream bandwidth than downstream, and is more susceptible to contention in dense residential buildings. This is the defining topology difference from Western hybrid environments where WFH users typically have symmetric gigabit or high-quality cable connections.
The asymmetry creates a persistent diagnostic trap: the WFH user's own audio sounds fine to them because their inbound (download) path is clean. Everyone else on the call hears the degradation. Complaints come from the office side, get assigned to the office network, and waste investigation cycles. The per-leg view in Control Hub is the only clean resolution to this ambiguity.
Indian Tier 1 city offices often have genuinely good connectivity — 100 Mbps dedicated Airtel Business or Tata IQ fibre in a modern Bangalore or Mumbai office park delivers consistent, clean quality. The problem is the other end of the call. This reality inverts the Western assumption that office connectivity is the variable to optimise. In India, it is frequently the WFH endpoint that needs the fix.
On MPLS: many Indian enterprises are still running 4–10 Mbps circuits to branch offices sized in 2018 or earlier — circuits that were never meant to carry video collaboration at scale. The economics have shifted: a dedicated 50 Mbps DIA connection at a branch costs a fraction of an equivalent MPLS upgrade, and with Cisco Meraki SD-WAN at the branch, the manageability gap between the two has largely closed. If branch voice quality is persistently poor and your MPLS circuits are more than three years old, the question is not how to tune QoS on a congested pipe — it is whether the pipe is still the right answer.
You have confirmed QoS is configured. Your ISP has confirmed the circuit is performing to spec. Your WFH users are on ethernet with dedicated SIMs. Your MPLS circuits have headroom. Control Hub is still showing 3.7 MOS on multiple calls per day.
This is when a Cisco TAC case is the right answer. Here is how to prepare one that gets resolved in hours rather than days.
What to Pull Before Opening the Case
TAC Case Opening — Template
Issue: Consistent Webex call quality degradation. MOS averaging 3.7–3.8 on [X] calls/day affecting [Y] users at [location] for [timeframe]. Steps already completed: QoS configured and confirmed (DSCP EF, Wireshark confirms markings preserved). ISP confirmed circuit to spec (iPerf data attached, no last-mile incident confirmed). WFH users moved to ethernet and dedicated SIM (no improvement). MPLS circuit at [location] running at [X]% average utilisation. Control Hub export attached. Packet capture attached. Traceroute output attached. Requesting: (1) confirmation that calls are routing to the correct regional PoP, (2) any media server-side degradation at the times noted, (3) whether codec negotiation is failing to a lower-quality fallback.
Proactive Data Systems' Webex engineering team handles call quality investigations as part of our deployment support — Control Hub health checks, QoS audits, ISP escalation support, and TAC case preparation. If you have run the diagnostics in this guide and are not finding a clear answer, we can review your data before you spend time on a TAC case that may not be necessary.
Book a Control Hub Health Check
We review your call quality data, identify patterns, give you a prioritised fix list. No slide deck.
Webex Deployment Checklist for Indian Enterprises
QoS config, PoP routing, ISP selection, WFH endpoint standards. One download.
Source: Cisco Webex Network Requirements documentation; ITU-T G.107 E-Model. India PoP latency and ISP throughput figures: Proactive Data Systems field observations and WFH deployment assessments, India metros, 2024–2026. SD-WAN jitter improvement data: Proactive Data Systems deployment records, 2025.
Note: Control Hub navigation reflects the interface as of Q1 2026. Cisco configuration paths apply to IOS-XE 17.x on Catalyst 9000 series and Meraki firmware MX 18.x and above. ISP performance figures are representative averages and will vary by provider, city, and circuit type.
We'll get back to you shortly.